This course get you the knowledge of how to acquire the statistical data analysis wrangling and visualization skills that will be useful for your career.
Following things are learned from this course,such as:
- This course gives you from basic to advanced most common Python data wrangling and visualization tasks.
- It will also equip you to use most important Python Data wrangling and visualization packages such as seaborn.
- Through this course you learn the most of data visualizations concepts in a practical manner so that you can apply those concepts for practical data analysis and interpretation.
- Learn how to decide which data wrangling and visualization techniques are best suited to answer your questions and applicable to your data and interpret the results.
 +91-6374114721
 +1-6502652492
 +91-7530088009
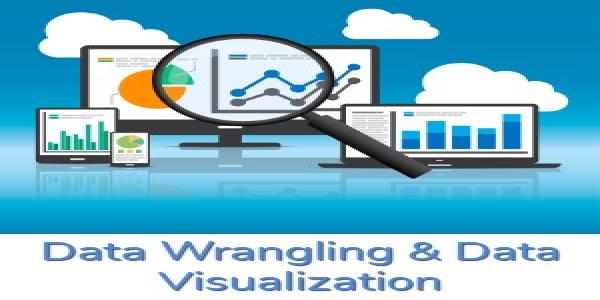


Write A Public Review